Jira comes with many built-in reports to provide insights into progress, release health, time logged, forecasts, and more. Each Jira application type, deployment type and project type contain different reports however. I’ve compiled a list of the report types and their definitions in Jira Software, so you don’t have to!
Tip: Be sure to consider reporting options when choosing between project types.
Sections: Jira Software: Cloud | Company-managed Scrum Project |
Company-managed Kanban Project | Team-managed Scrum Project |
Team-managed Kanban Project | Jira Software: Server and Data Center |
Scrum Project | Kanban Project | Extending Reporting Capabilities
Jira Software: Cloud
COMPANY-MANAGED SCRUM PROJECT
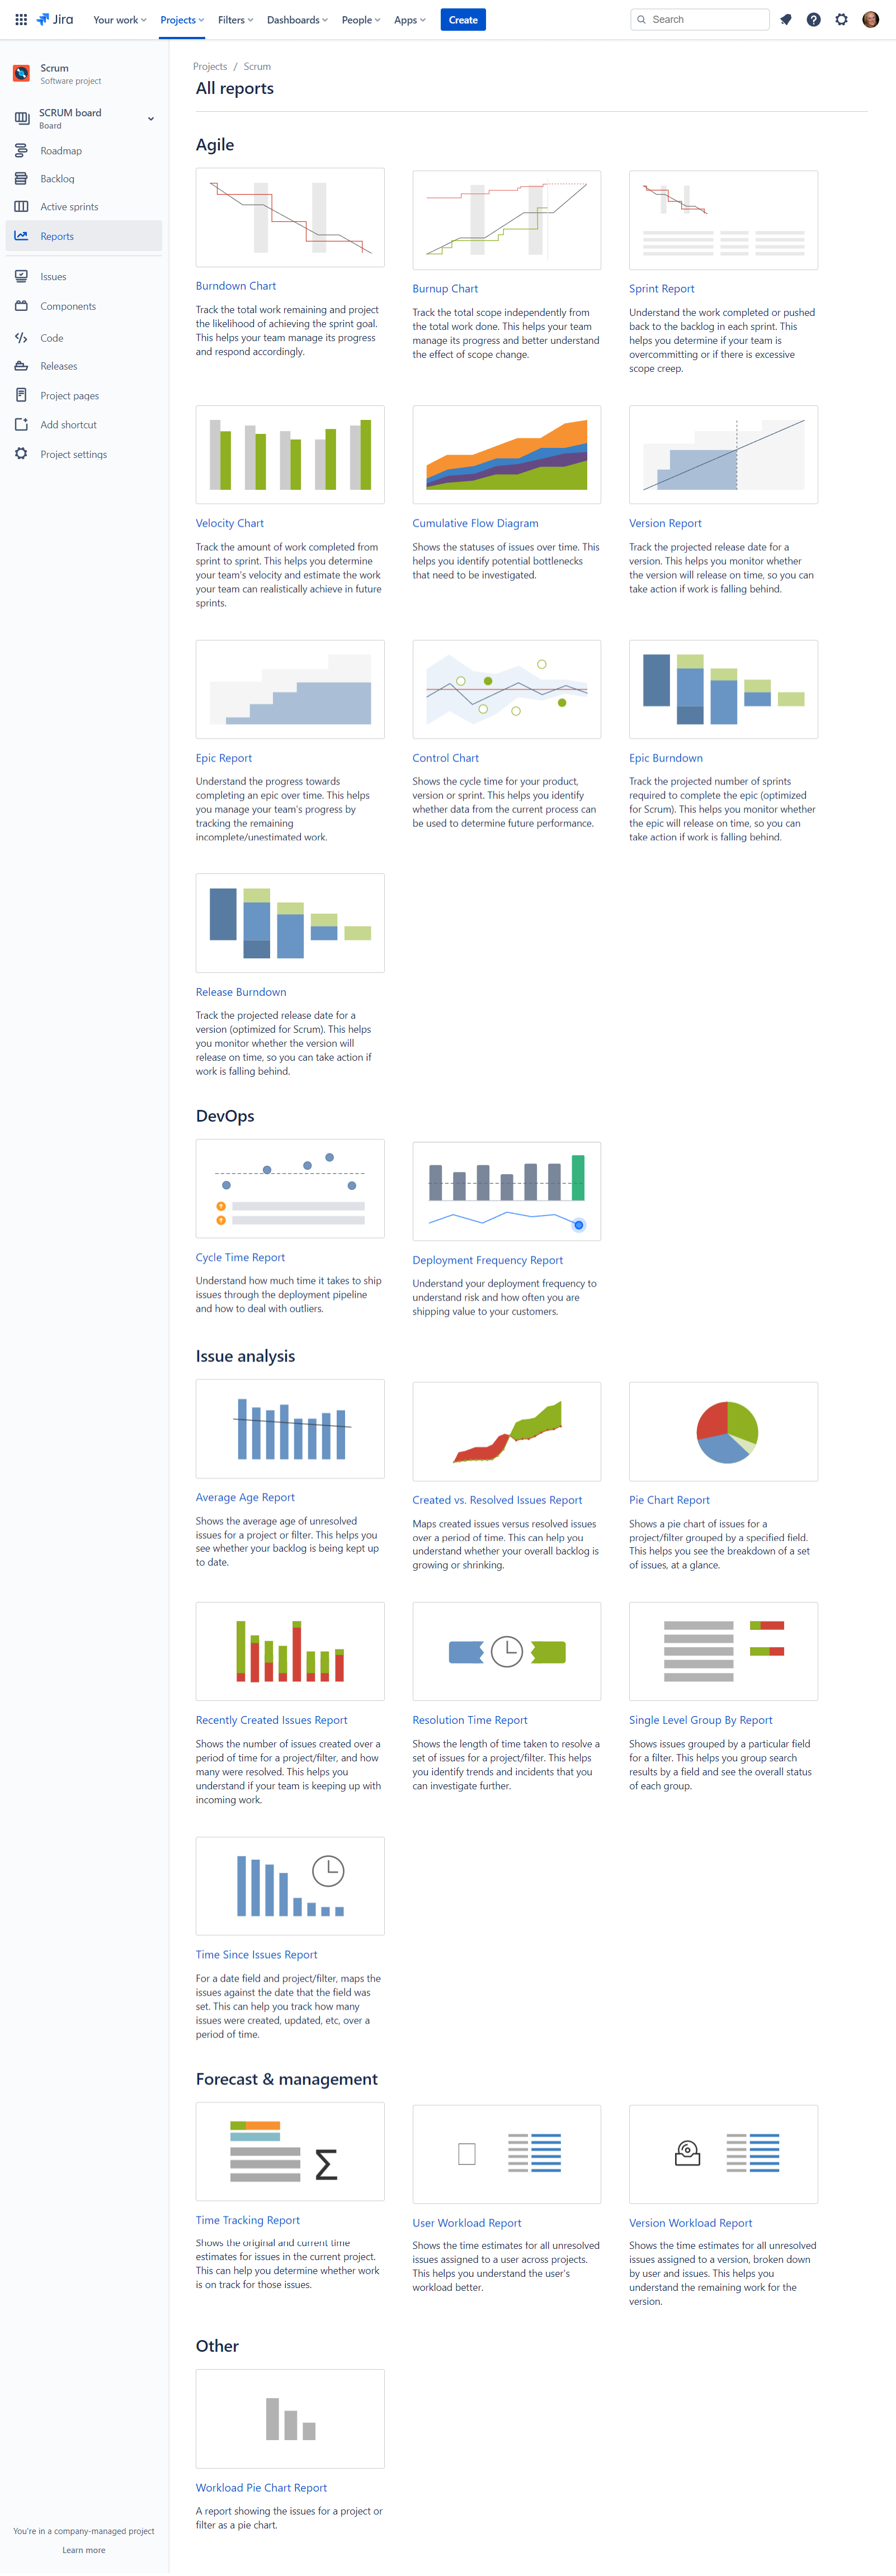
Report count: 23
Unique reports: Cycle Time Report, Deployment Frequency Report, and Workload Pie Chart Report
Agile
- Burndown Chart – Track the total work remaining and project the likelihood of achieving the sprint goal. This helps your team manage its progress and respond accordingly.
- Burnup Chart – Track the total scope independently from the total work done. This helps your team manage its progress and better understand the effect of scope change.
- Sprint Report – Understand the work completed or pushed back to the backlog in each sprint. This helps you determine if your team is overcommitting or if there is excessive scope creep.
- Velocity Chart – Track the amount of work completed from sprint to sprint. This helps you determine your team’s velocity and estimate the work your team can realistically achieve in future sprints.
- Cumulative Flow Diagram – Shows the statuses of issues over time. This helps you identify potential bottlenecks that need to be investigated.
- Version Report – Track the projected release date for a version. This helps you monitor whether the version will release on time, so you can take action if work is falling behind.
- Epic Report – Understand the progress towards completing an epic over time. This helps you manage your team’s progress by tracking the remaining incomplete/unestimated work.
- Control Chart – Shows the cycle time for your product, version or sprint. This helps you identify whether data from the current process can be used to determine future performance.
- Epic Burndown – Track the projected number of sprints required to complete the epic (optimized for Scrum). This helps you monitor whether the epic will release on time, so you can take action if work is falling behind.
- Release Burndown – Track the projected release date for a version (optimized for Scrum). This helps you monitor whether the version will release on time, so you can take action if work is falling behind.
DevOps
- Cycle Time Report– Understand how much time it takes to ship issues through the deployment pipeline and how to deal with outliers.
- Deployment Frequency Report – Understand your deployment frequency to understand risk and how often you are shipping value to your customers.
Issue analysis
- Average Age Report – Shows the average age of unresolved issues for a project or filter. This helps you see whether your backlog is being kept up to date.
- Created vs. Resolved Issues Report – Maps created issues versus resolved issues over a period of time. This can help you understand whether your overall backlog is growing or shrinking.
- Pie Chart Report – Shows a pie chart of issues for a project/filter grouped by a specified field. This helps you see the breakdown of a set of issues, at a glance.
- Recently Created Issues Report – Shows the number of issues created over a period of time for a project/filter, and how many were resolved. This helps you understand if your team is keeping up with incoming work.
- Resolution Time Report – Shows the length of time taken to resolve a set of issues for a project/filter. This helps you identify trends and incidents that you can investigate further.
- Single Level Group By Report – Shows issues grouped by a particular field for a filter. This helps you group search results by a field and see the overall status of each group.
- Time Since Issues Report – For a date field and project/filter, maps the issues against the date that the field was set. This can help you track how many issues were created, updated, etc, over a period of time.
Forecast & management
- Time Tracking Report – Shows the original and current time estimates for issues in the current project. This can help you determine whether work is on track for those issues.
- User Workload Report – Shows the time estimates for all unresolved issues assigned to a user across projects. This helps you understand the user’s workload better.
- Version Workload Report – Shows the time estimates for all unresolved issues assigned to a version, broken down by user and issues. This helps you understand the remaining work for the version.
Other
- Workload Pie Chart Report – A report showing the issues for a project or filter as a pie chart.
COMPANY-MANAGED KANBAN PROJECT
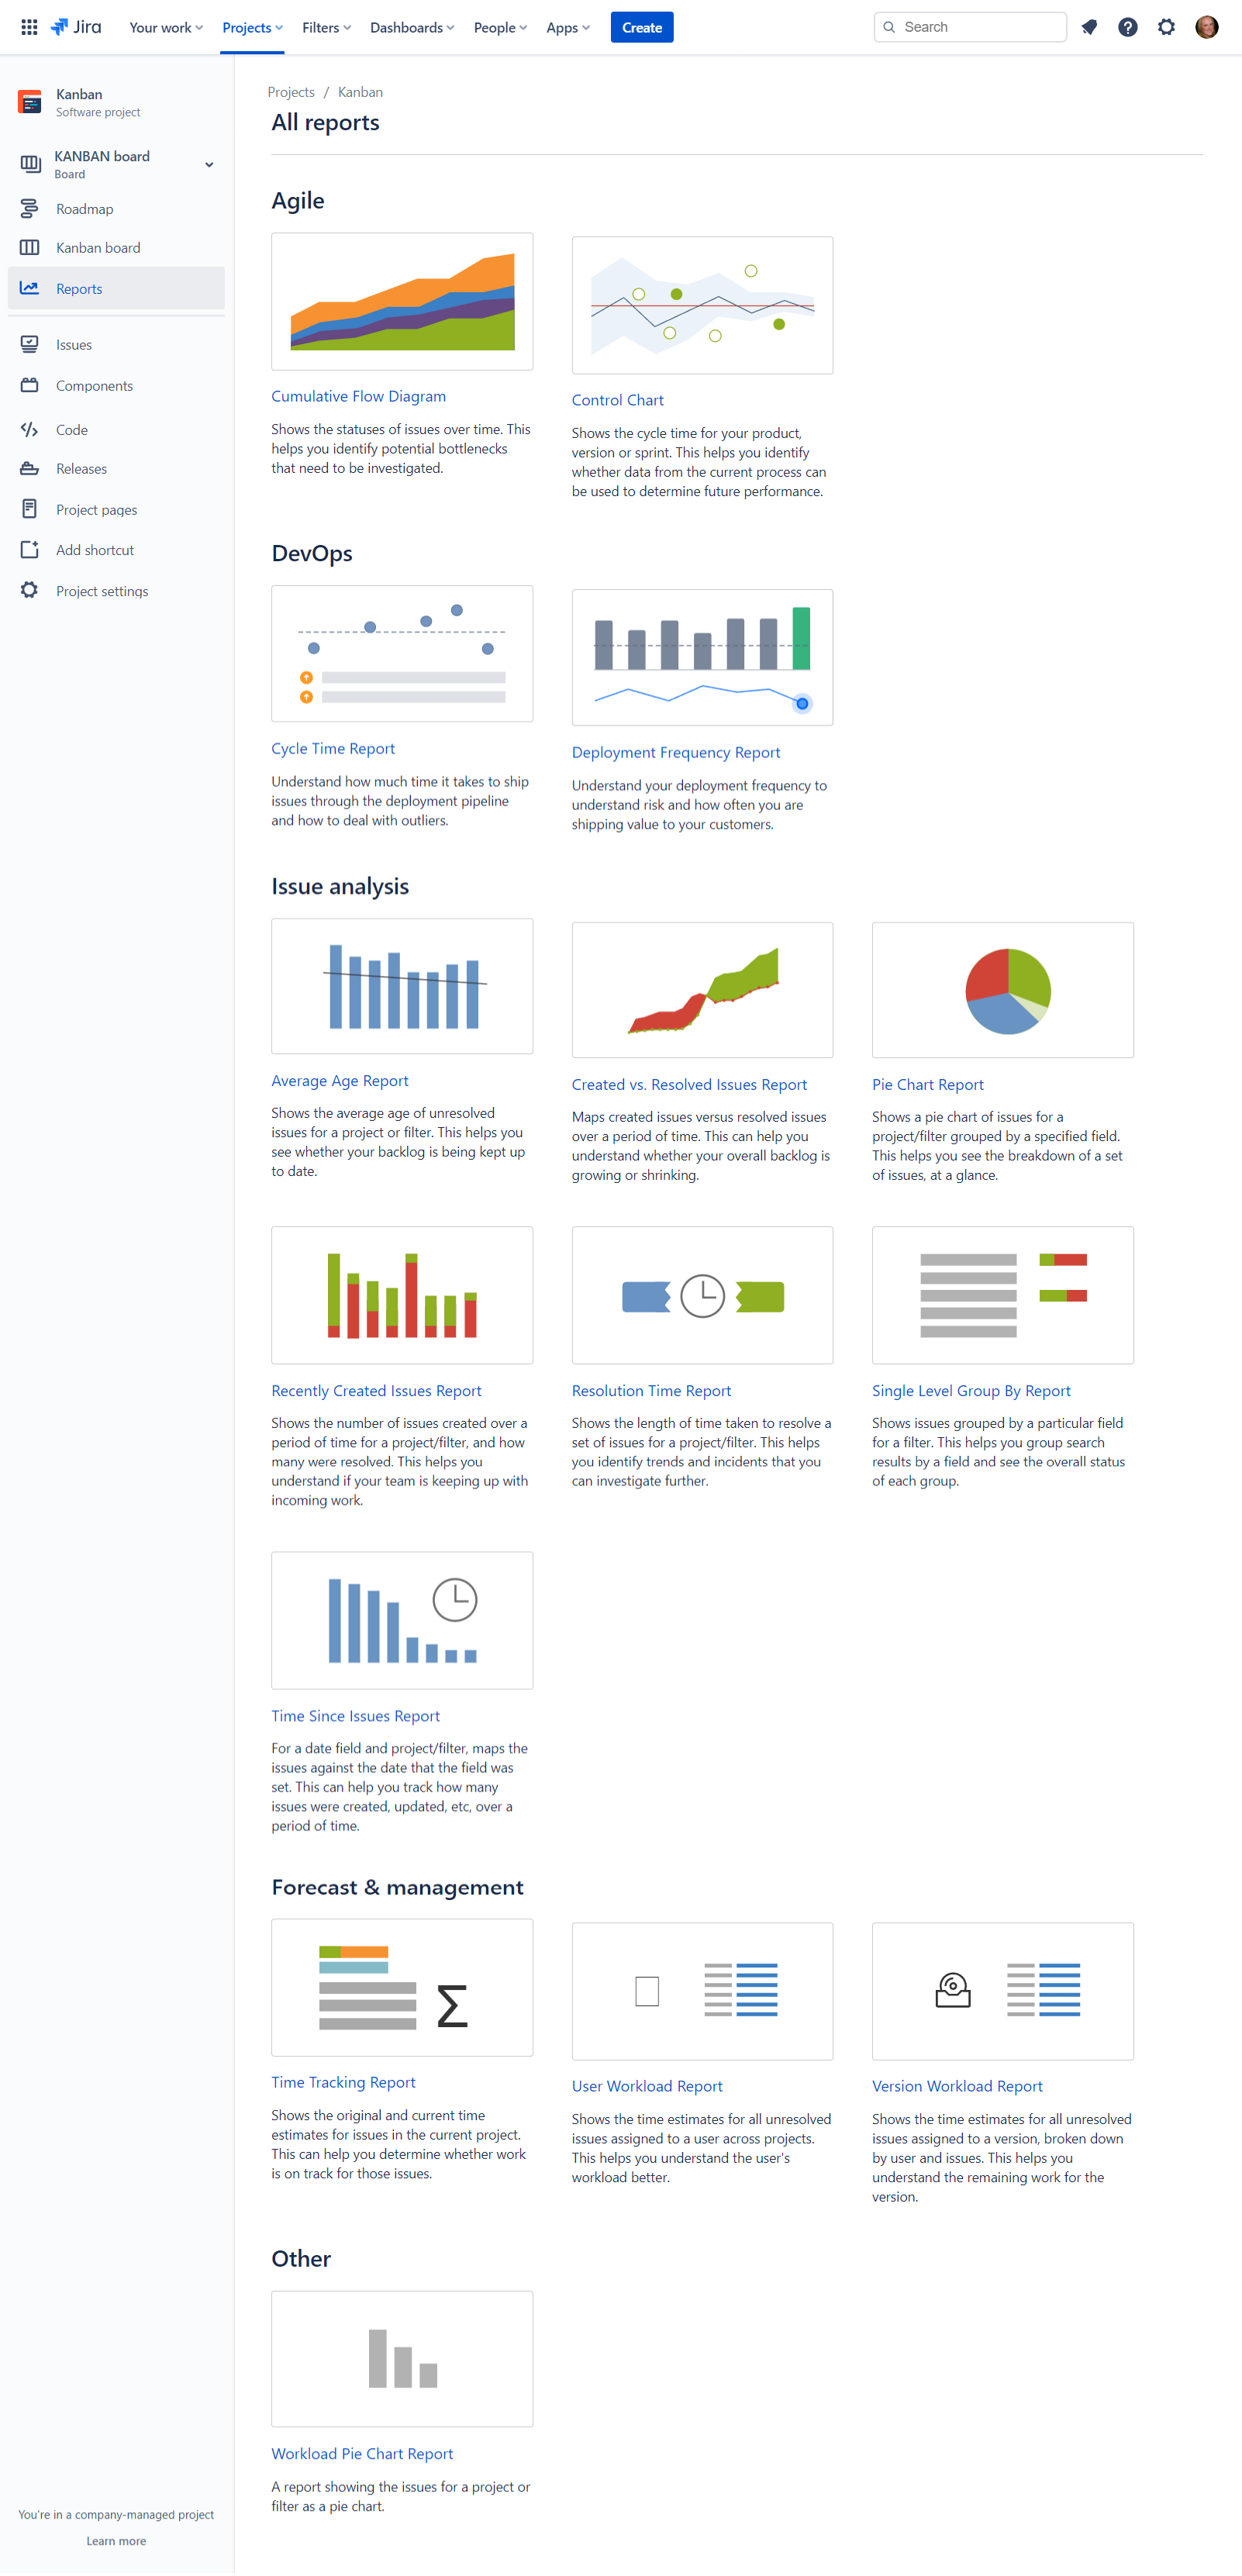
Report count: 15
Agile
- Cumulative Flow Diagram – Shows the statuses of issues over time. This helps you identify potential bottlenecks that need to be investigated.
- Control Chart – Shows the cycle time for your product, version or sprint. This helps you identify whether data from the current process can be used to determine future performance.
DevOps
- Cycle Time Report – Understand how much time it takes to ship issues through the deployment pipeline and how to deal with outliers.
- Deployment Frequency Report – Understand your deployment frequency to understand risk and how often you are shipping value to your customers.
Issue analysis
- Average Age Report – Shows the average age of unresolved issues for a project or filter. This helps you see whether your backlog is being kept up to date.
- Created vs. Resolved – Issues ReportMaps created issues versus resolved issues over a period of time. This can help you understand whether your overall backlog is growing or shrinking.
- Pie Chart Report – Shows a pie chart of issues for a project/filter grouped by a specified field. This helps you see the breakdown of a set of issues, at a glance.
- Recently Created Issues Report – Shows the number of issues created over a period of time for a project/filter, and how many were resolved. This helps you understand if your team is keeping up with incoming work.
- Resolution Time Report – Shows the length of time taken to resolve a set of issues for a project/filter. This helps you identify trends and incidents that you can investigate further.
- Single Level Group By Report – Shows issues grouped by a particular field for a filter. This helps you group search results by a field and see the overall status of each group.
- Time Since Issues Report – For a date field and project/filter, maps the issues against the date that the field was set. This can help you track how many issues were created, updated, etc, over a period of time.
Forecast & management
- Time Tracking Report – Shows the original and current time estimates for issues in the current project. This can help you determine whether work is on track for those issues.
- User Workload Report – Shows the time estimates for all unresolved issues assigned to a user across projects. This helps you understand the user’s workload better.
- Version Workload Report – Shows the time estimates for all unresolved issues assigned to a version, broken down by user and issues. This helps you understand the remaining work for the version.
Other
- Workload Pie Chart Report – A report showing the issues for a project or filter as a pie chart.
TEAM-MANAGED SCRUM PROJECT
Note: Application and project administrators need to enable this feature at: Project Settings > Features. See screenshot

- Burnup report – Visualize a sprint’s completed work and compare it with its total scope. Use these insights to track progress toward sprint completion.
- Sprint burndown chart – Track and manage the total work remaining within a sprint. After the sprint, summarize both team and individual performance.
- Velocity report – Predict the amount of work your team can commit to in future sprints by seeing and reviewing the amount of value delivered in previous ones.
- Note: A completed sprint is required
- Cumulative flow diagram – Shows the statuses of your project’s issues over time. See which columns accumulate more issues, and identify bottlenecks in your workflow.
- Cycle Time Report – Understand how much time it takes to ship issues through the deployment pipeline and how to deal with outliers.
- Deployment Frequency Report – Understand your deployment frequency to understand risk and how often you are shipping value to your customers.
TEAM-MANAGED KANBAN PROJECT
Note: Application and project administrators need to enable this feature at: Project Settings > Features. See screenshot Additionally, some reports require sprints. Enable them on the features page too, if desired.

Same as the team-managed scrum project above.
Jira Software: Server and Data Center
SCRUM PROJECT
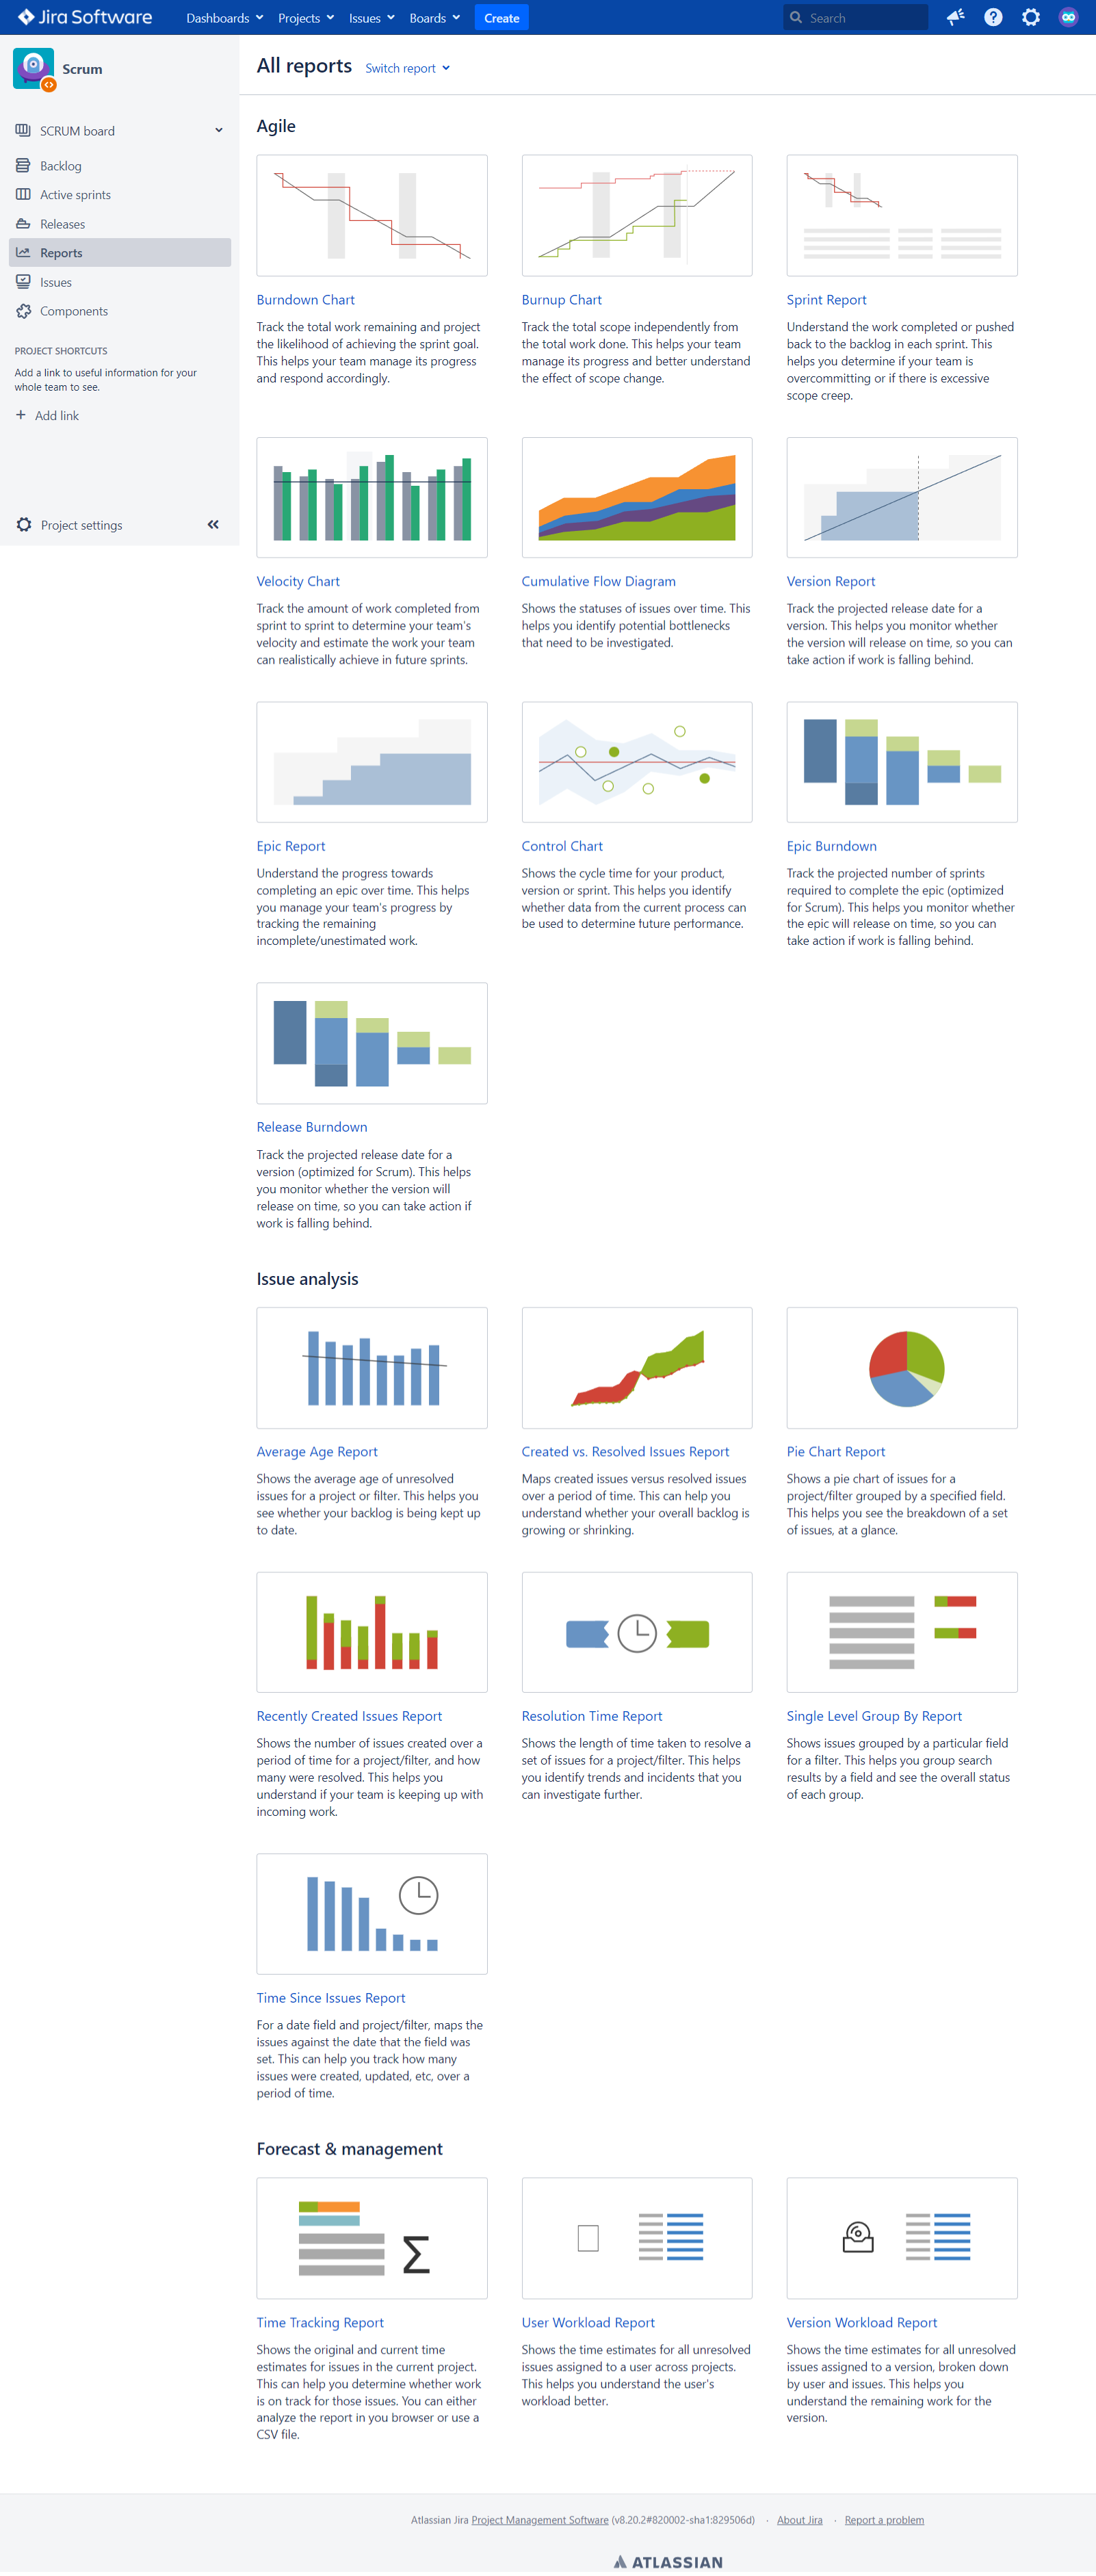
Same as the company-managed scrum project above without the following reports: Cycle Time Report, Deployment Frequency Report, and Workload Pie Chart Report
KANBAN PROJECT
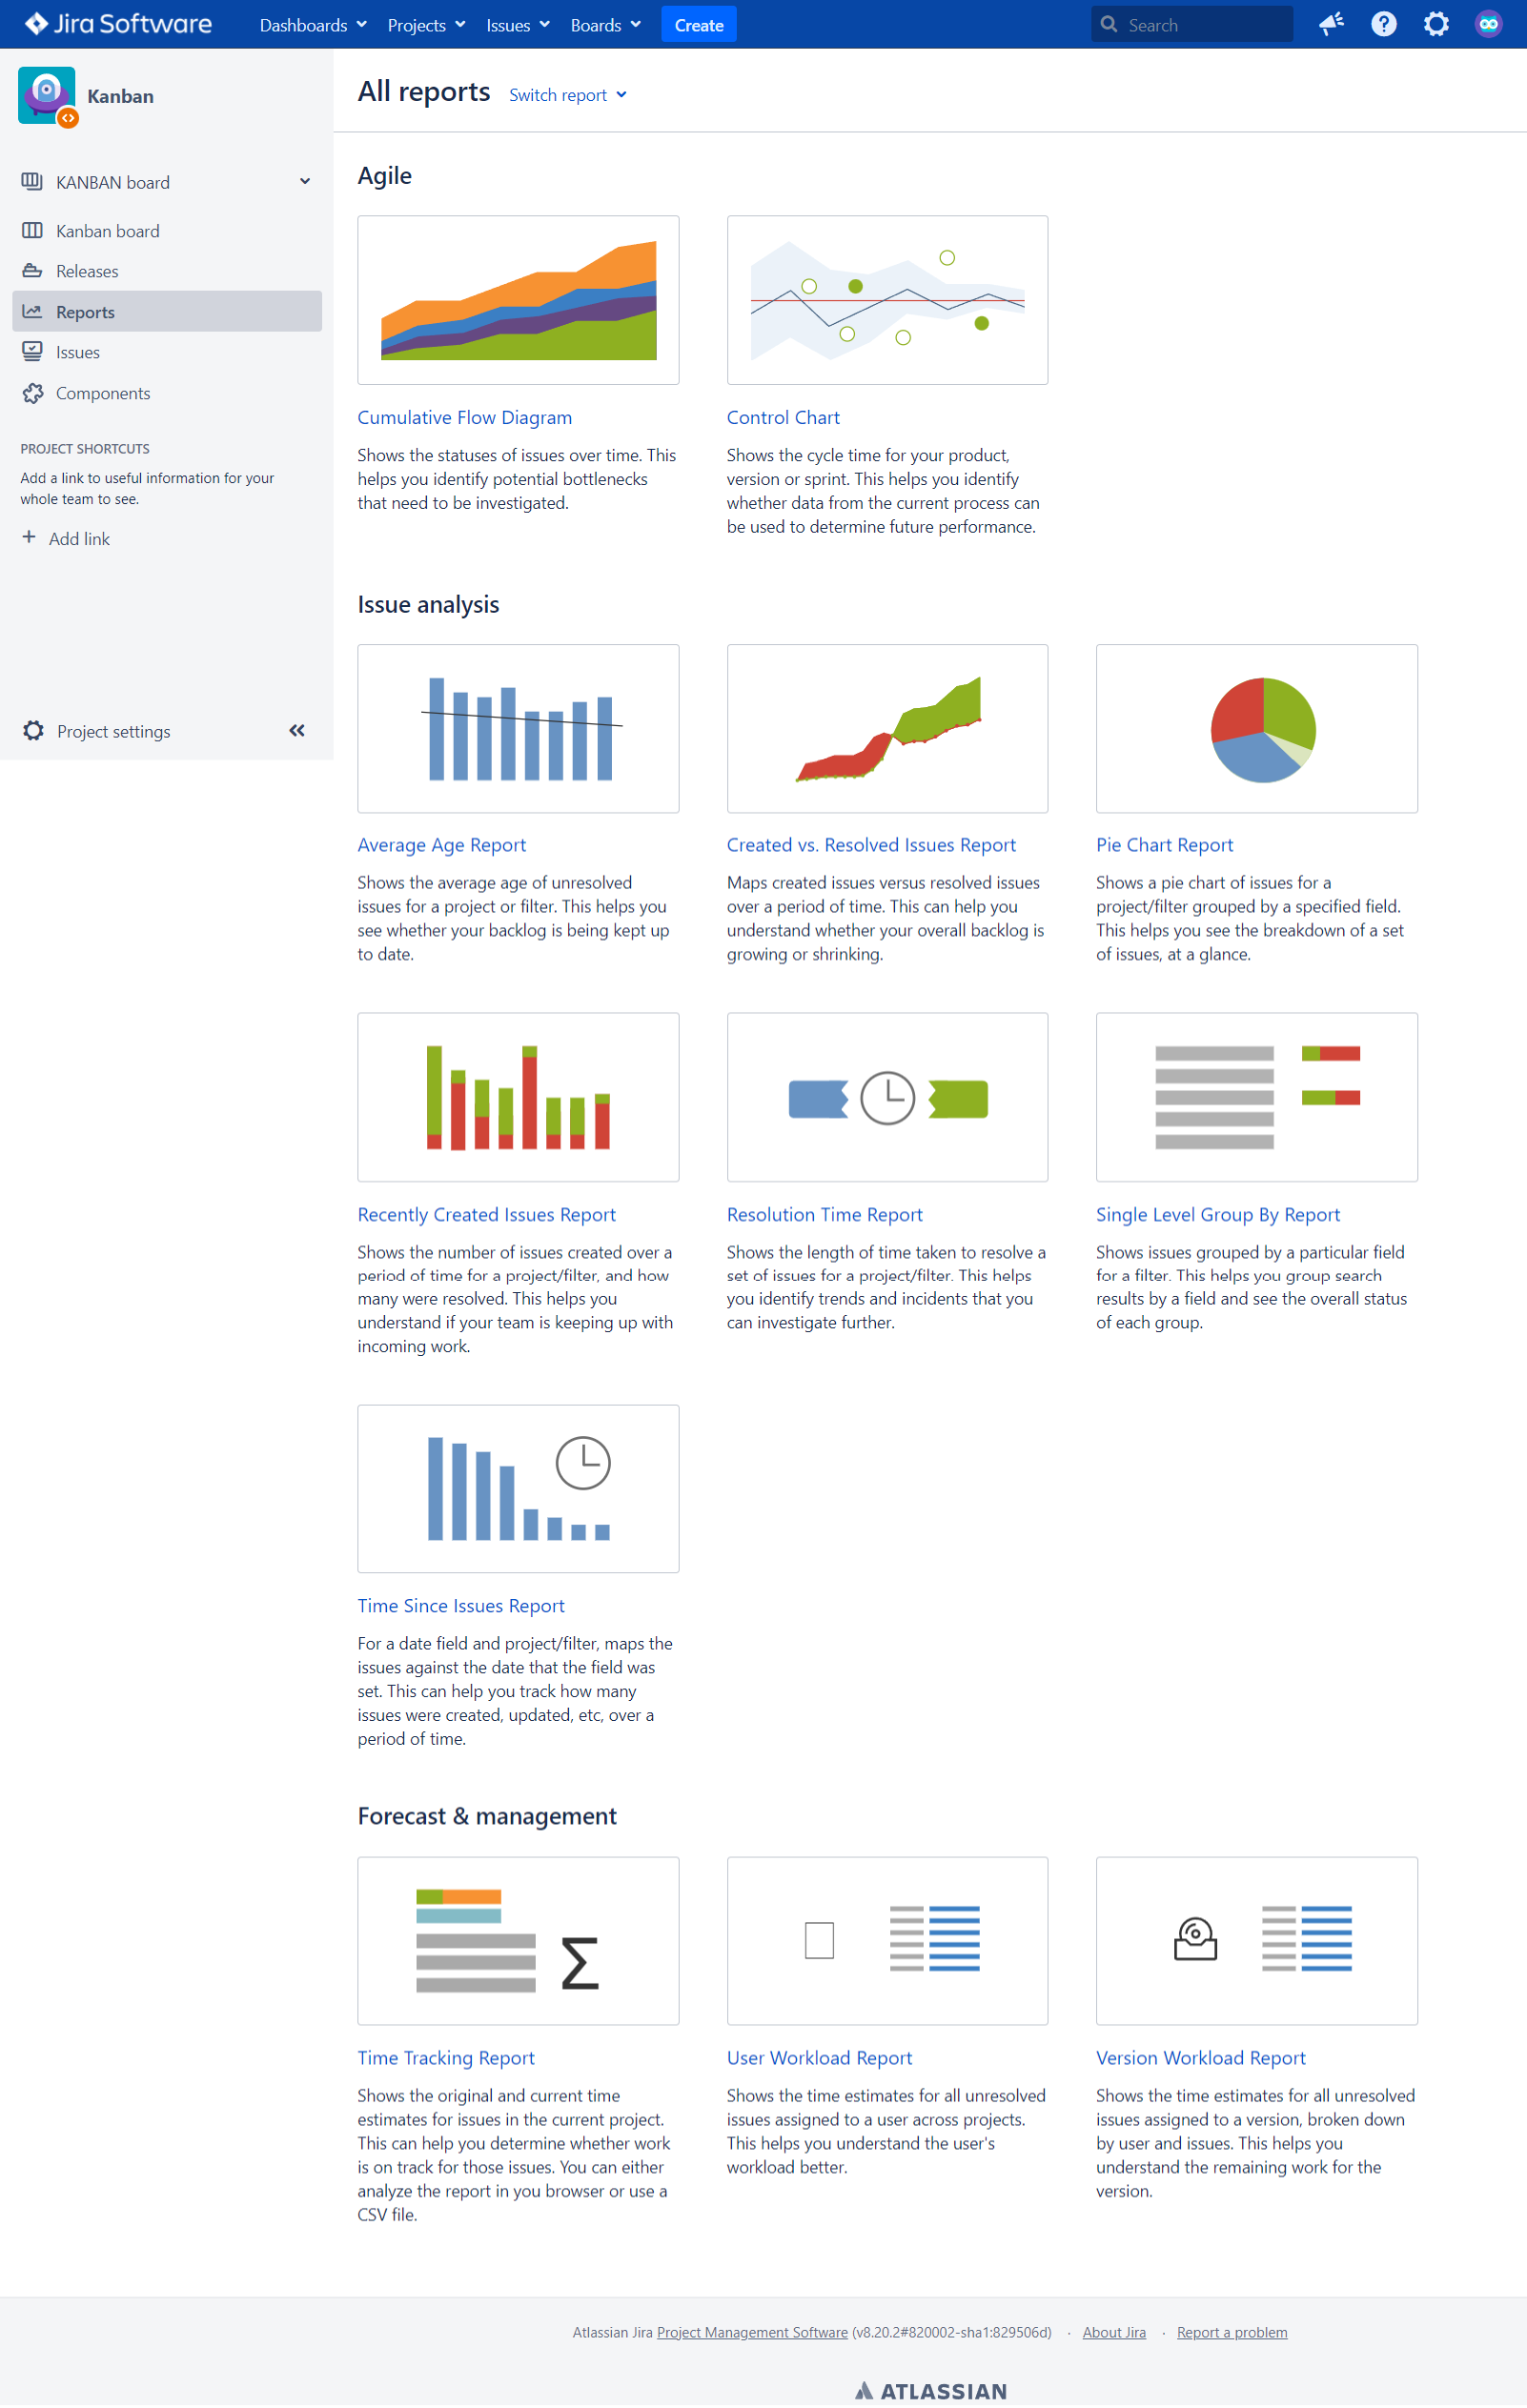
Same as the company-managed kanban project above without the following reports: Cycle Time Report, Deployment Frequency Report, and Workload Pie Chart Report
Extending Reporting Capabilities
Most reports are customizable and if you can’t get to the data you’re after, there are plenty of apps available in the Atlassian Marketplace.
