
Understanding the Atlassian Account and User Model
Do you have multiple Jira Cloud applications to manage? Here’s how they all work together in the Atlassian organization and […]
Do you have multiple Jira Cloud applications to manage? Here’s how they all work together in the Atlassian organization and […]
You already know that Jira is a great tool for project management, but did you know that it has a

It’s my 12th Atlassian Community Leader Anniversary! I remember when I first logged in,Not sure where to start or where

It’s almost Halloween and that means it’s time to watch Jira Scary Stories! Rachel Wright, a Certified Jira Administrator and
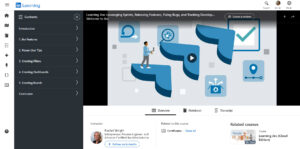
After over a decade as a Jira administrator and multiple published books, I’ve finally created the course I wish I
Between March 2025 and July 2025 Atlassian progressively rolled out a new navigation experience to all Cloud users in Jira,
In a previous article, I shared an example of my Jira Code, Snippet, and Example Library as a place to
I got my start in web development in the late 1990s. I taught myself HTML and spent every minute I
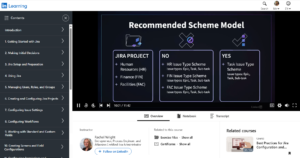
Atlassian’s vision is always evolving. It took me years to properly say the tongue twister “Issue type screen scheme”. Now